 2022-01-25

Background: Diabetes is a long-term disease characterized by high blood sugar and has risen as a public health problem globally. Exploring and analyzing diabetes data is a timely concern because it may prompt a variety of serious illnesses, including stroke, kidney failure, heart attacks, etc. Several existing pieces of research have revealed that diabetes data, such as systolic blood pressure (SBP), diastolic blood pressure (DBP), weight, height, age, etc., can provide insightful information about patients diabetes states. However, very few studies have focused on visualizing diabetes mellitus (DM) insights to support healthcare administrator (HA)' s goals adequately, such as (i) decision-making, (ii) identifying and grouping associated factors, and (iii) analyzing large data effectively remains unexplored.
Objective: This study aims to design an interactive Visualization system (Vis) to explore diabetes mellitus (DM) insights and its associated factors in Bangladesh.
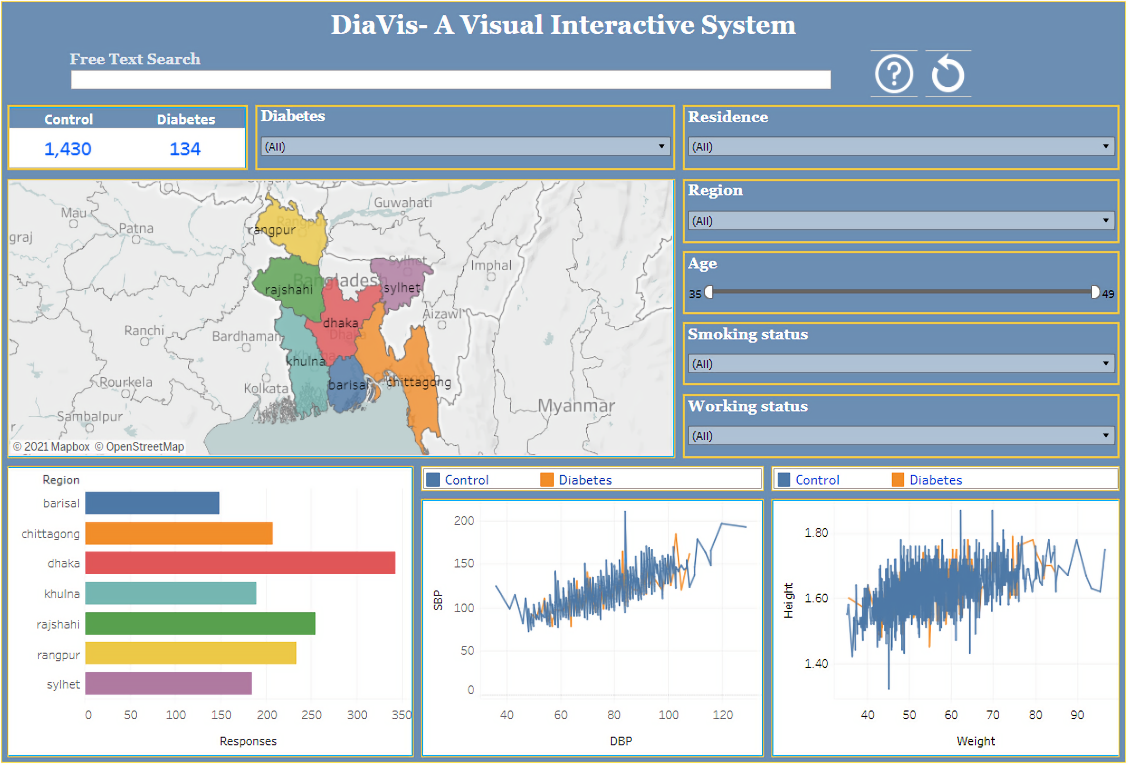
Methods: In this study, first, a case study method has employed to understand diabetes data. Second, we examine the potential of user-centered technology in addressing these challenges and design a Vis named "DiaVis" to process and present raw data in the form of graphics, graphs, and processed text, as well as a variety of user interaction possibilities. It helps to extract valuable data and present it in a simple and easy-to-understand way. Moreover, we highlight some key insights from our study that may help explore the healthcare community.
Results: A user study with 20 individuals is used to evaluate our system. By allowing iterative exploration and modification of data in a dashboard with multiple-coordinated views, the DiaVis system improves the flow of visual analysis.
Conclusion: This study suggests that the healthcare community should pay more attention to developing appropriate policy measures to reduce the risk of DM.
Keywords:Diabetes disease; visual analytics; visual interactive system; qualitative analysis; machine learning

背景:糖尿病是一种具有高血糖特征的慢性疾病,目前已成为全球公共卫生问题。探索和分析糖尿病数据应得到实时关注,因为其可能引发多种重大疾病,包括中风、肾衰竭、心脏病发作等。现有研究表明,收缩压(SBP)、舒张压(DBP)、体重、身高、年龄等糖尿病数据可以为分析糖尿病患者的病情提供有效信息。然而,很少有研究聚焦于糖尿病(DM)数据的可视化分析,以优化医疗保健管理者(HA)的管理策略,如(i)决策制定,(ii)相关因素的识别与分组,以及(iii)有效分析大量数据。此类研究仍待探索。
目的:本研究旨在设计交互式可视化系统(Vis),以探索孟加拉国糖尿病(DM)现状及其相关影响因素。
方法:本研究首先采用案例研究法来了解糖尿病相关数据。其次,探究了以用户为中心的技术在解决这些挑战的可能性;于此同时,设计了名为 “DiaVis” 的交互式可视化系统(Vis),并以图表、图形和处理过的文本,以及各种用户交互的可能性的形式去处理和呈现原始数据。此外,本研究中的得出的关键结论有助于我们探索医疗界的相关问题。
结果:本研究采用20人参与的用户研究方法去评估DiaVis系统。通过在具有多个协调视图的仪表板中对数据的迭代探索和修改,DiaVis系统优化了可视化分析流程。
结论:这项研究表明,医疗界应制定相应的政策措施,以降低糖尿病的风险。
关键词:糖尿病;视觉分析;视觉交互系统;定量分析;机器学习
